
 (Sequence),
 (C_Date) and
 (R_Date)
icons into the model you are building.
This has the advantage that the user does not have to worry about the
syntax of entering the information (brackets, semi-colons etc).
However, underlying the windows interface the program creates a text file
with a list of commands.
(R_Date)
icons into the model you are building.
This has the advantage that the user does not have to worry about the
syntax of entering the information (brackets, semi-colons etc).
However, underlying the windows interface the program creates a text file
with a list of commands.As an example of this consider the process of making up a multi-plot which was discussed in the section on producing a multi-plot. In that case an input window was opened and a few radiocarbon dates were added. Unknown to the user a command file was produced which might have looked something like:
Plot "Example 1"
{
 R_Date "OxA-1011" 2340 60;
 R_Date "OxA-1012" 3550 70;
 R_Date "OxA-1013" 3670 50;
};
The user then would use the  button (or the
[File|Analyse] menu item) to perform the calculation and the
button (or the
[File|Analyse] menu item) to perform the calculation and the  button (or the [File|Create Plots] menu item) to
actually create and display the plot.
button (or the [File|Create Plots] menu item) to
actually create and display the plot.All information is added in essentially the same way. The right hand pane of the input window has a tree organised into the various different types of information you might wish to add.
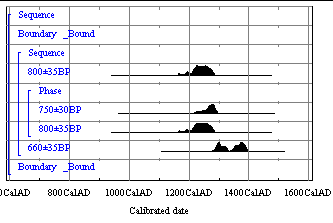
Let us consider one of the examples given in section on `Archaeological Considerations':
Sequence
{
 Boundary;
 Sequence
 {
  R_Date 800 35;
  Phase
  {
   R_Date 750 30;
   R_Date 800 35;
  };
  R_Date 660 35;
 };
 Boundary;
};
To enter the data for this press the  button to
get a new window. Then find the
button to
get a new window. Then find the
 (Sequence) icon
in the tree in the right hand window pane and drag it onto the
(Sequence) icon
in the tree in the right hand window pane and drag it onto the
 icon in the left hand pane. You will be
prompted for a name for the sequence which is optional.
icon in the left hand pane. You will be
prompted for a name for the sequence which is optional.The program will they ask you if you wish to put automatic boundaries around this sequence - answer YES.
The first radiocarbon date would then be entered by dragging the
(R_Date) icon
over (ensuring that the sequence branch of the tree is expanded) and
dropped onto the  'Queries' icon within the sequence.
The phase can be added in the same way but this time say NO to the addition
of surrounding boundaries.
The two radiocarbon dates would then be added to the phase (while
it is expanded). The phase branch can then be minimised by pressing on
the associated
'Queries' icon within the sequence.
The phase can be added in the same way but this time say NO to the addition
of surrounding boundaries.
The two radiocarbon dates would then be added to the phase (while
it is expanded). The phase branch can then be minimised by pressing on
the associated  button.
The final radiocarbon date is then added after the phase as before.
Note that the sequence is in chronological order (oldest first).
button.
The final radiocarbon date is then added after the phase as before.
Note that the sequence is in chronological order (oldest first).

Items can be added in any order. Just remember that if you wish to add
items to a group (such as a phase) ensure that it is expanded (using
 if necessary) whereas if you wish to add an item
just after the group it should be collapsed (using
if necessary). Items can be moved around,
copied, pasted and deleted in the normal way. To change the values for
an item simply double click on the values.
From the windows interface it is always possible to delete the last item
or change the data if some mistake has been made.
if necessary) whereas if you wish to add an item
just after the group it should be collapsed (using
if necessary). Items can be moved around,
copied, pasted and deleted in the normal way. To change the values for
an item simply double click on the values.
From the windows interface it is always possible to delete the last item
or change the data if some mistake has been made.
The actual text of the input can be seen in the bottom left hand pane of
the window by dragging up the bar just above the bottom. This text can
be edited directly as long as you press the  button first.
Clearly such editing does not have the safeguards associated with
Windows entry and so care must be taken to keep the syntax of the commands
correct (see `CQL Command Summary').
button first.
Clearly such editing does not have the safeguards associated with
Windows entry and so care must be taken to keep the syntax of the commands
correct (see `CQL Command Summary').
Once the data has been entered save it using the
button.
Such files should have the file extension .14i.
They can then be recalled using the  button.
You can copy and paste whole tree branches from one model to another
if you wish.
button.
You can copy and paste whole tree branches from one model to another
if you wish.
Adding a large number of (for example) radiocarbon dates from a database or spreadsheet is easy. The format should be two columns (date and error) or three (name, date and error). Simply copy the data from the database/spreadsheet and paste it into the model tree.
button. Make sure that the left hand pane of the
correct input window is selected. In the example we are considering this
will first of all perform the calibrations and then perform a statistical
method called `Markov Chain Monte-Carlo (MCMC) Sampling' to incorporate the stratigraphic
information (see Buck et al 1992 and
Gilks et al 1996).
When the calculations have finished a plot organiser window will be shown
which allows you to select the form in which you want the results.

This looks rather like input file and can be manipulated in a similar
way. There are essentially two ways of using this: the toolbar can be
used to generate the results in text form (using the
 button) or in plot form (using the
button); alternatively individual elements can
be selected by double clicking on then in the plot organiser window.
button) or in plot form (using the
button); alternatively individual elements can
be selected by double clicking on then in the plot organiser window.
The results are given in two text formats:
the latter being most useful for entry into databases and spreadsheets.Plots can be generated in several different forms using the toolbar:
Normal multiple plots (as shown below)
 Individual plots for each item
 Plots on the calibration curve
And the posterior distributions which are the result of the full analysis like this:
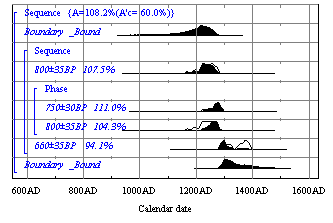
Here the dark histograms show the posterior distributions and the outlines the priors (no account taken of the constraints). Note that the bourdaries mean that it has been assumed that all of the events come from one uniformly represented period. For this reason the last date is more likely to be similar to the others than to be an outlier.
This has completed all of the steps needed to perform the calculations.
A large number of data files are produced during the calculations and if
you have finished with all of these you can press the
 button to delete all of these for this project.
Any plot archives which have been saved will not be deleted but all log
files, data files and plot organisation files will be deleted.
button to delete all of these for this project.
Any plot archives which have been saved will not be deleted but all log
files, data files and plot organisation files will be deleted.
button
 button
 to perform the calculations
button
button to perform the calculations
 button
 Full log file
 Tabulated results (single ranges)